Building a realistic SOC lab: Elastic + Fleet + Mythic C2 + OSTicket
TL;DR
I built a miniaturized SOC environment to simulate the full analyst lifecycle: from log ingestion to threat detection and ticketing. Using Vultr, Fleet, Elastic, and Mythic C2, I simulated a live attack scenario to test detection rules and automated triage workflows. This post covers the architecture, key configurations, a live attack simulation, and the resulting investigation.
Goals
The primary objective was to move beyond simple log collection and build a functional detection pipeline.
- Simulate the Workflow: Replicate the entire lifecycle: Detection → Alert → Ticket → Triage.
- High-Fidelity Telemetry: Ingest realistic data sources (Sysmon, Defender, Linux Auth) rather than generic logs.
- Validation: Test detection logic against real-world scenarios (SSH brute force, RDP cracking, and C2 exfiltration).
- Automation: Pipe enriched alerts directly into osTicket to reduce manual data entry and speed up triage.
Architecture
The lab is hosted within a Vultr VPC to ensure network isolation while allowing full visibility into traffic between hosts.
- Defensive Stack:
- Elastic + Kibana: The SIEM core used for log aggregation, indexing, and visualization.
- Fleet Server: Handles agent management and policy updates.
- osTicket: Used for incident management, integrated via API for automated ticket creation.
- Endpoints:
- Ubuntu: Runs a standard SSH service to generate auth logs and invite brute-force attempts.
- Windows Server 2022: The primary target. configured with Sysmon (using Olaf Hartong’s hardened config) and Defender event forwarding to capture process execution and script block logging.
- Offensive Stack:
- Mythic C2: Used to generate payloads, manage agents, and execute the attack campaign.
Dashboards & Visualizations
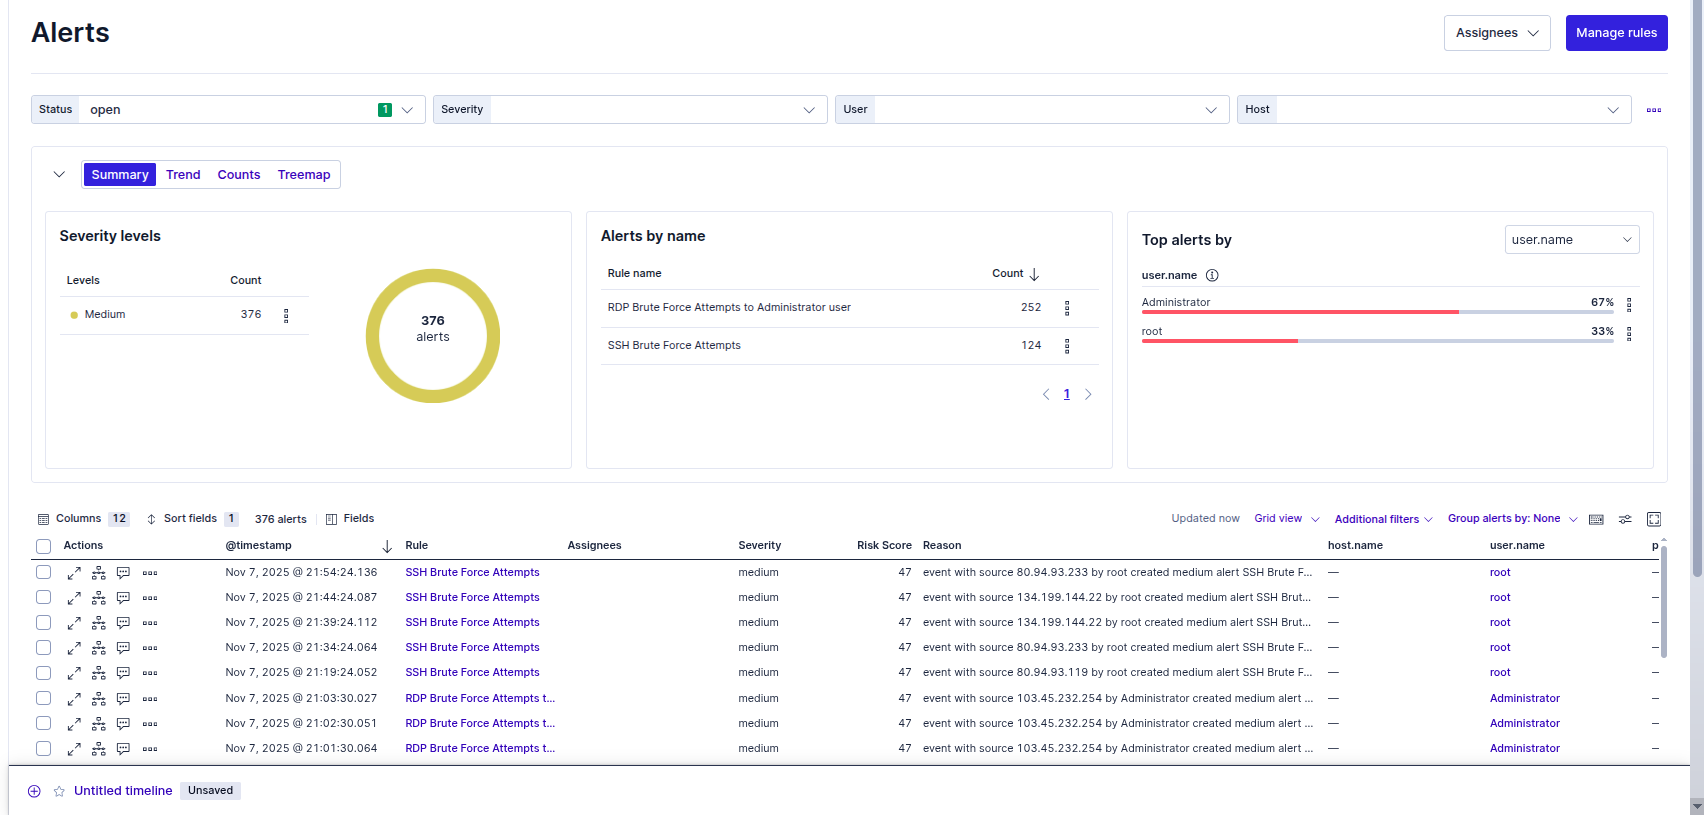
I built custom dashboards to filter the noise of internet-wide scanning and highlight specific indicators of compromise.
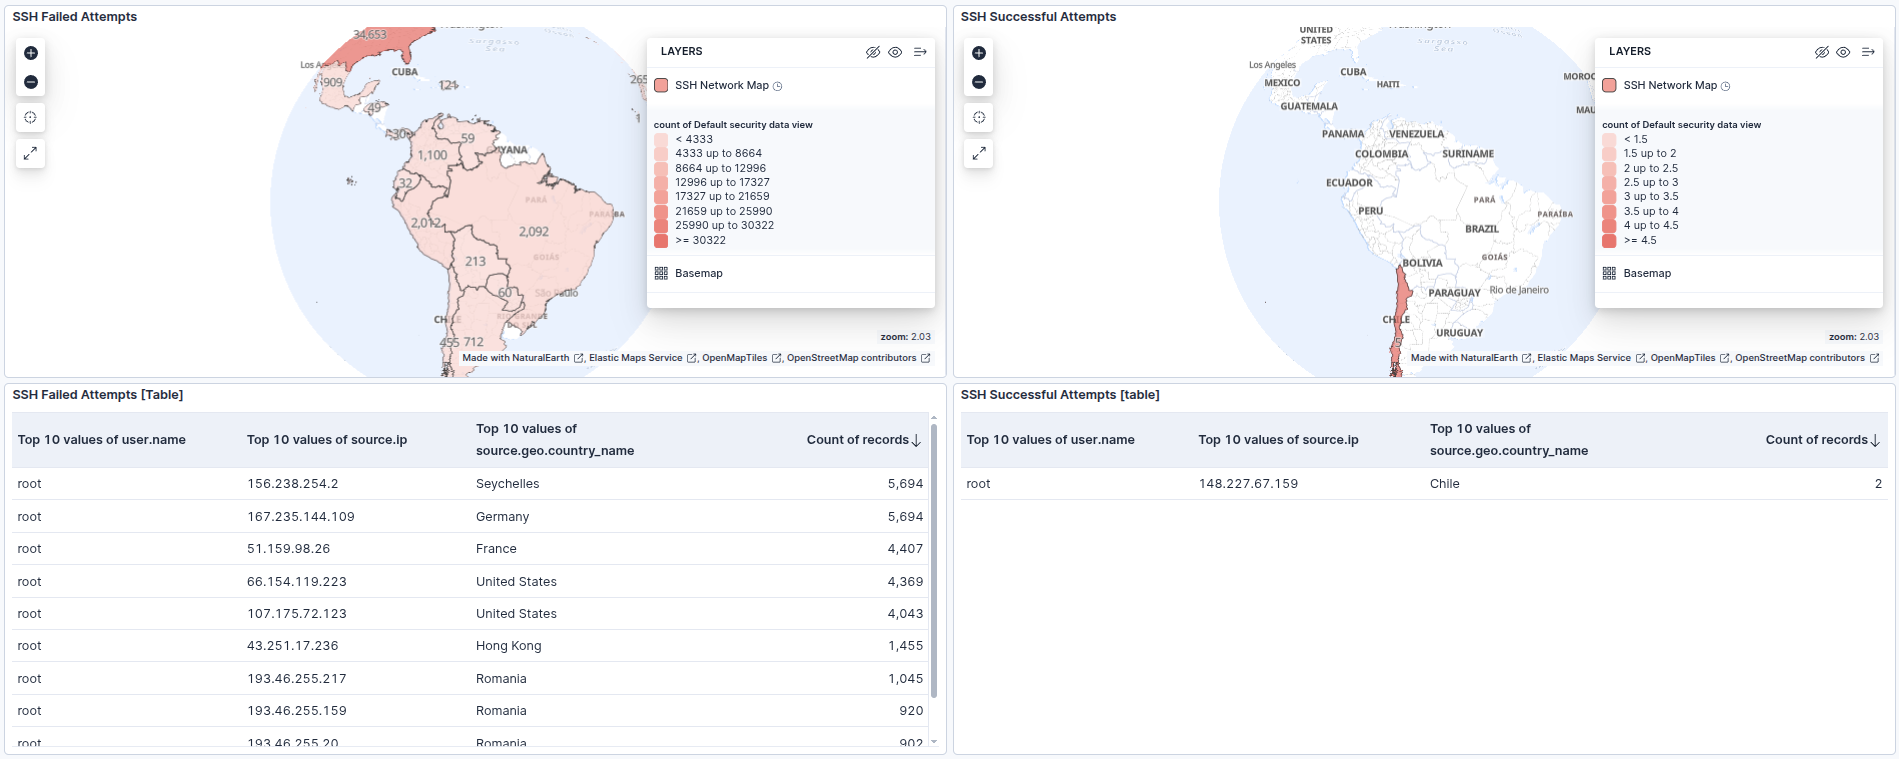
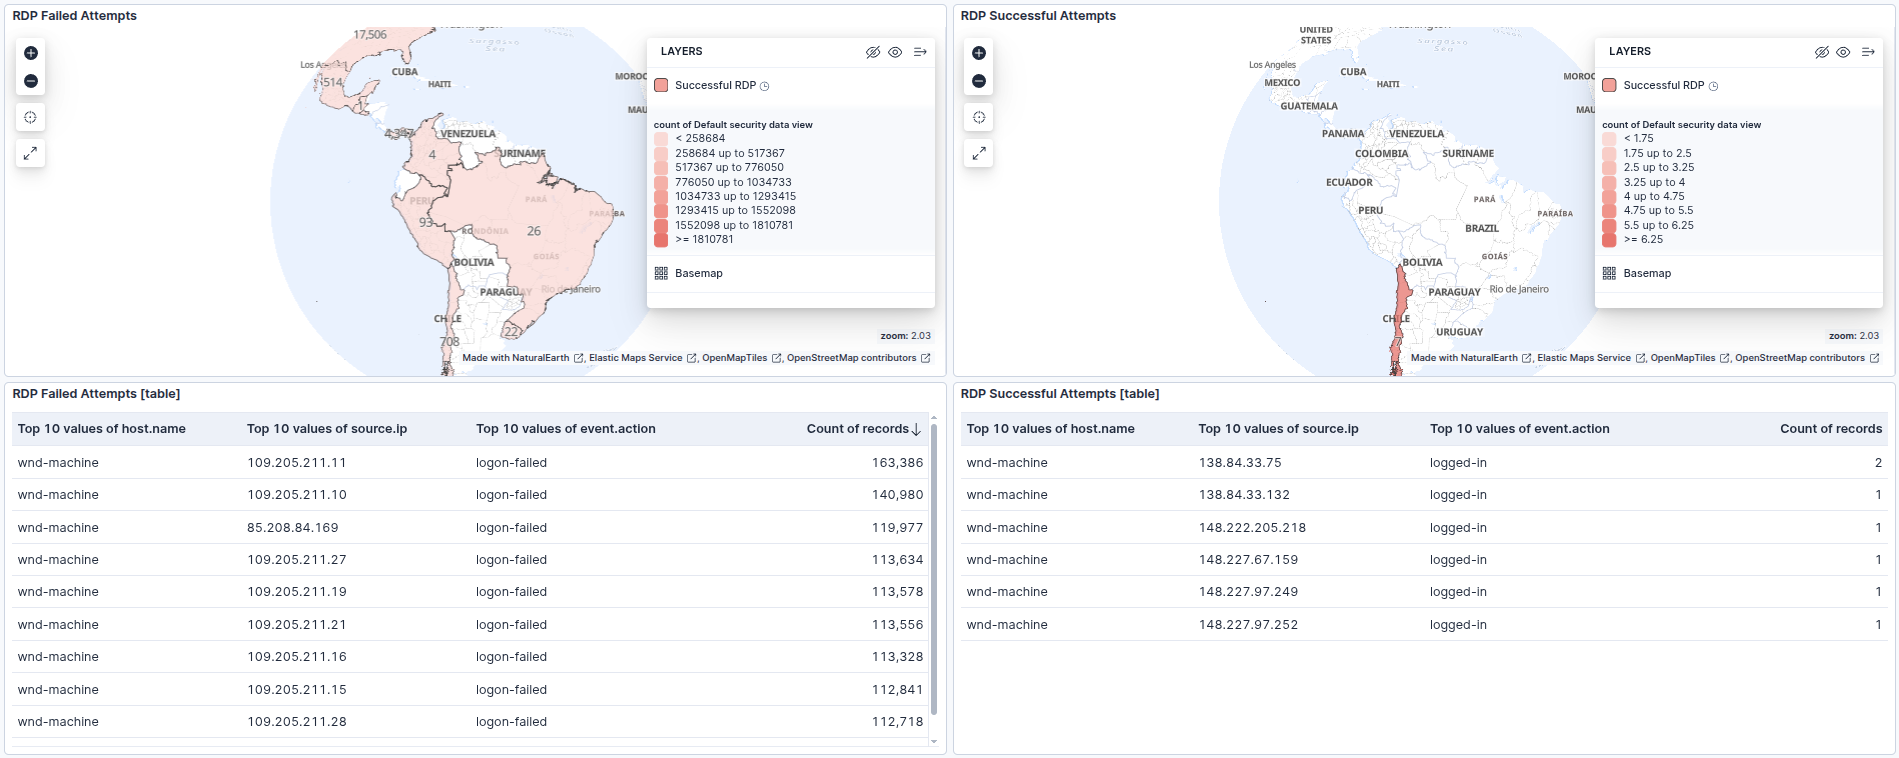
- SSH & RDP Activity: Maps and tables that visualize the volume of failed login attempts versus the critical few successful logins.
- Windows Suspicious Activity: A focused view comprised of three critical tables:
- Process Creation: Monitors high-risk binaries like
powershell.exe,cmd.exe, andrundll32.exe. - Network Connections: Correlates processes with outbound traffic to identify C2 beacons.
- Defender Status: Specifically watches for Event Code 5001 (Defender Disabled) to catch defense evasion attempts.
- Process Creation: Monitors high-risk binaries like
Attack Phase
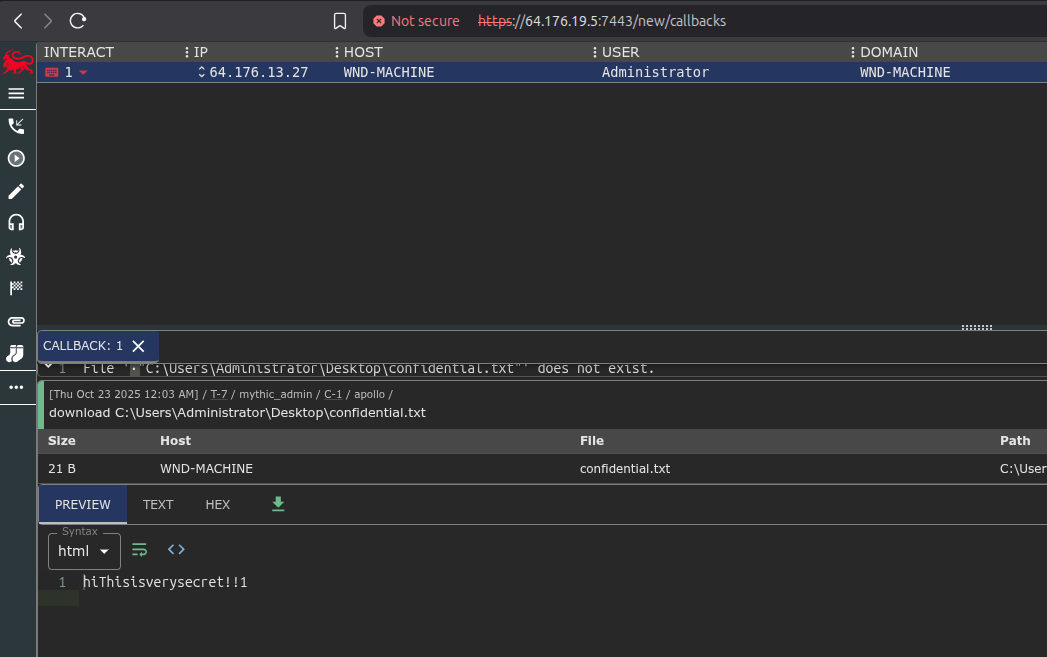
To kick things off, I needed to lower the target’s security posture to ensure the payload would execute without immediate blocking. I manually disabled Windows Defender Real-time protection on the WND-MACHINE and set a weak administrative password to simulate a vulnerable environment. I also planted a dummy target file, confidential.txt, on the desktop to test our exfiltration capabilities.
For the intrusion itself, I used the Mythic C2 framework. I generated an HTTP-based executable payload (coolgames.exe) and transferred it to the victim machine. Once executed, it established a session back to my C2 server. From there, I ran some basic reconnaissance commands to verify access and then issued the command to download confidential.txt.
As you can see in the Mythic console screenshot below, the file content (“HiThisisverysecret!!1”) was successfully exfiltrated.
Elastic Investigation
Switching over to the defense side, we reconstructed the entire chain of events using Elastic. The investigation followed a logical flow from the initial network anomaly back to the source process.
1. The Initial Trigger (Network Anomalies)
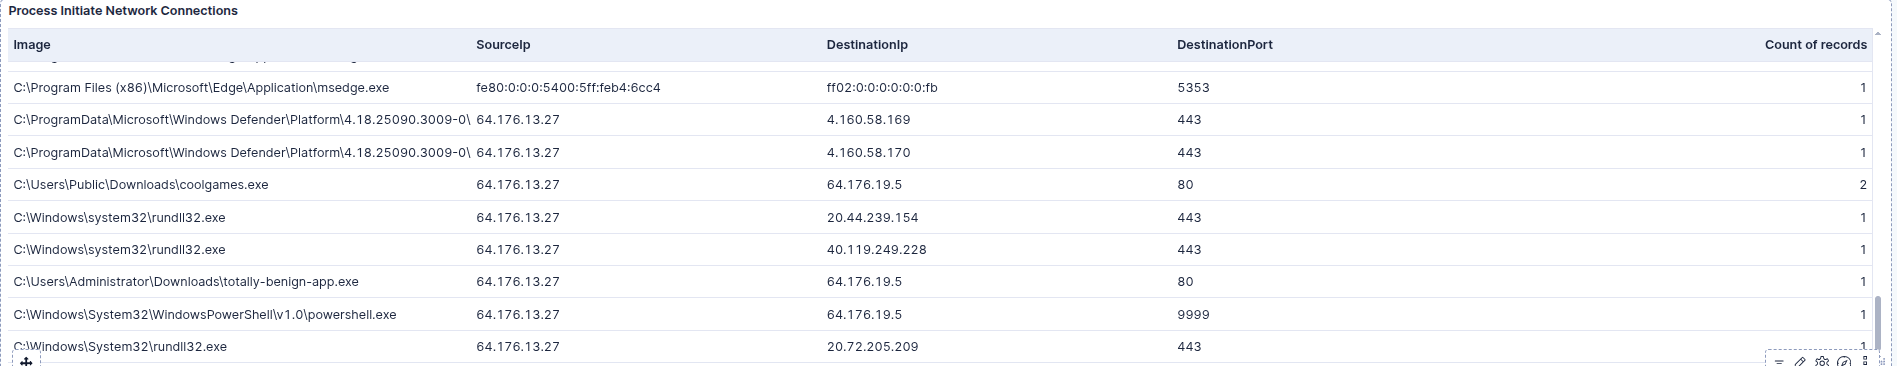
The investigation started with the Windows Suspicious Activity Dashboard. We noticed unusual outbound traffic in the “Process Initiate Network Connections” widget. Specifically, powershell.exe was communicating on port 9999, which is non-standard, while coolgames.exe was communicating over port 80.
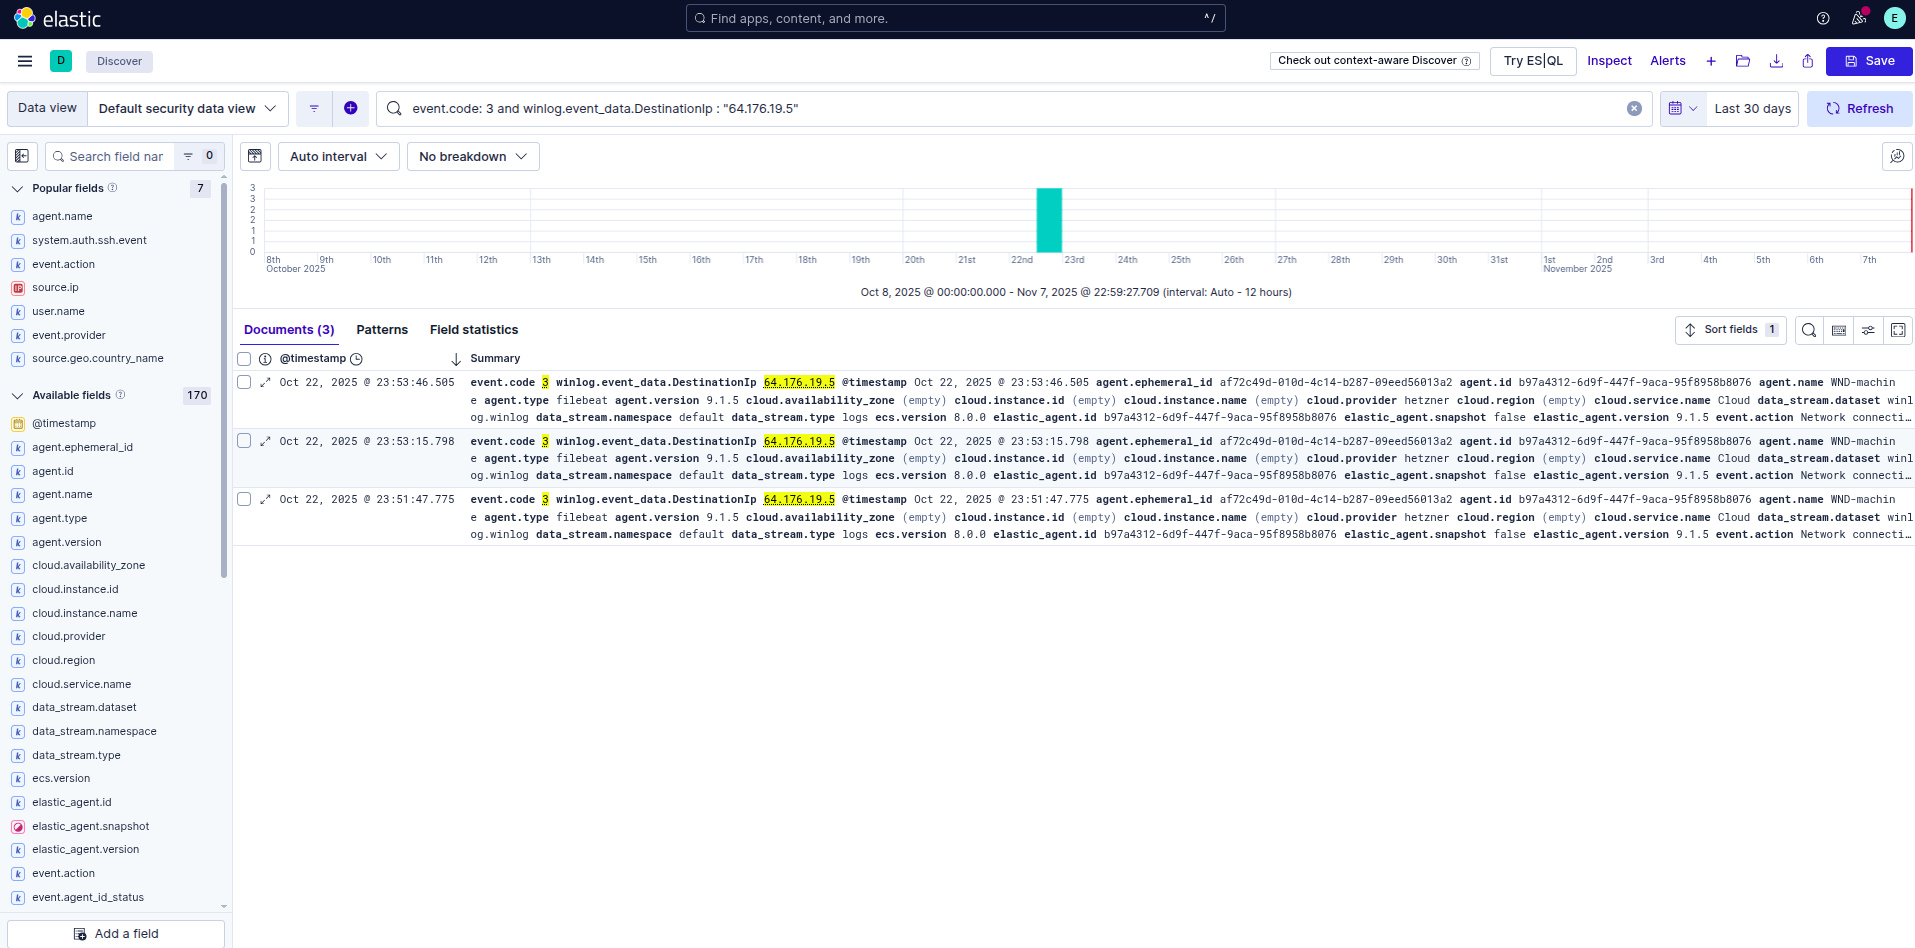
2. Analyzing the Connection (Event ID 3)
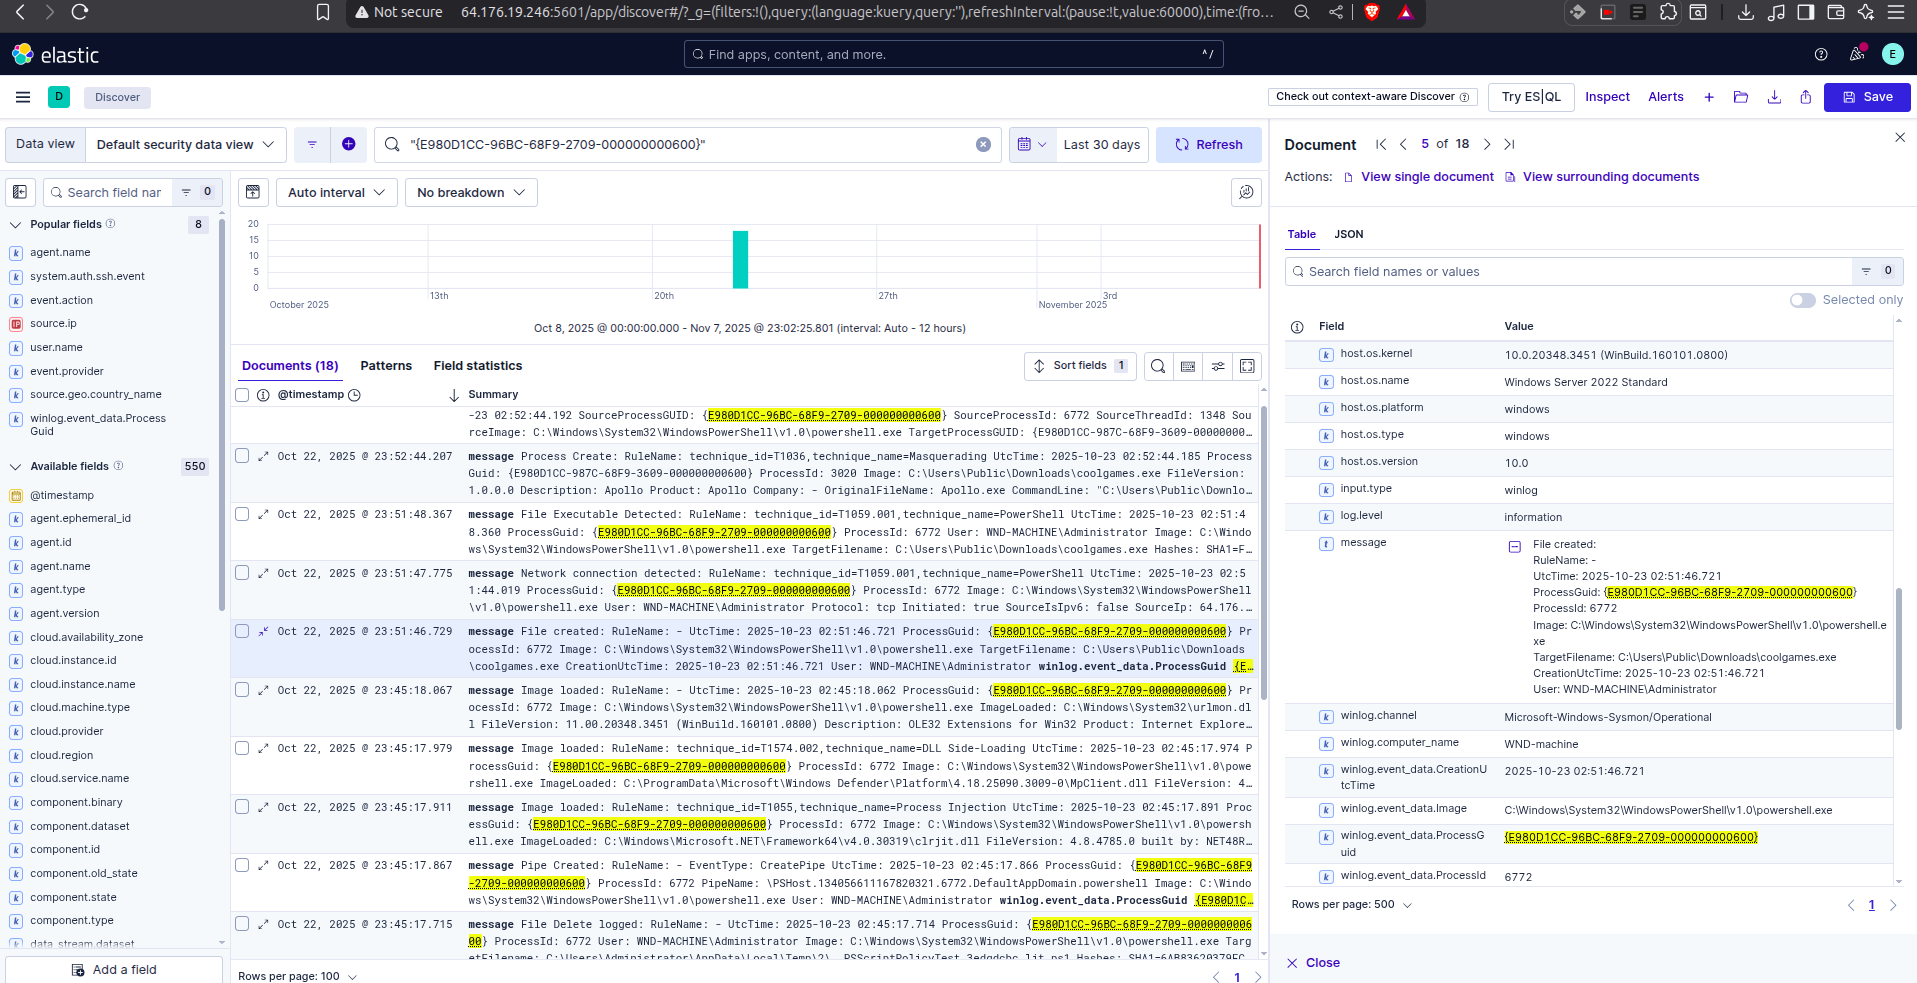
We drilled down into that specific PowerShell connection. By filtering for event.code: 3 (Network Connection) and the destination port, we confirmed that the internal host was reaching out to the external IP 64.176.19.5. This confirms the Command & Control (C2) channel was active.
3. Tracing the Source (File Creation & Execution)
Working backward from the network activity, we looked for the process that spawned this connection. Just seconds prior, at 23:51:46, we identified the creation and execution of the dropper file.
The timeline below shows the sequence: coolgames.exe is created, it executes, and then immediately spawns a powershell.exe process (Technique T1036 Masquerading) to hide its network activity.
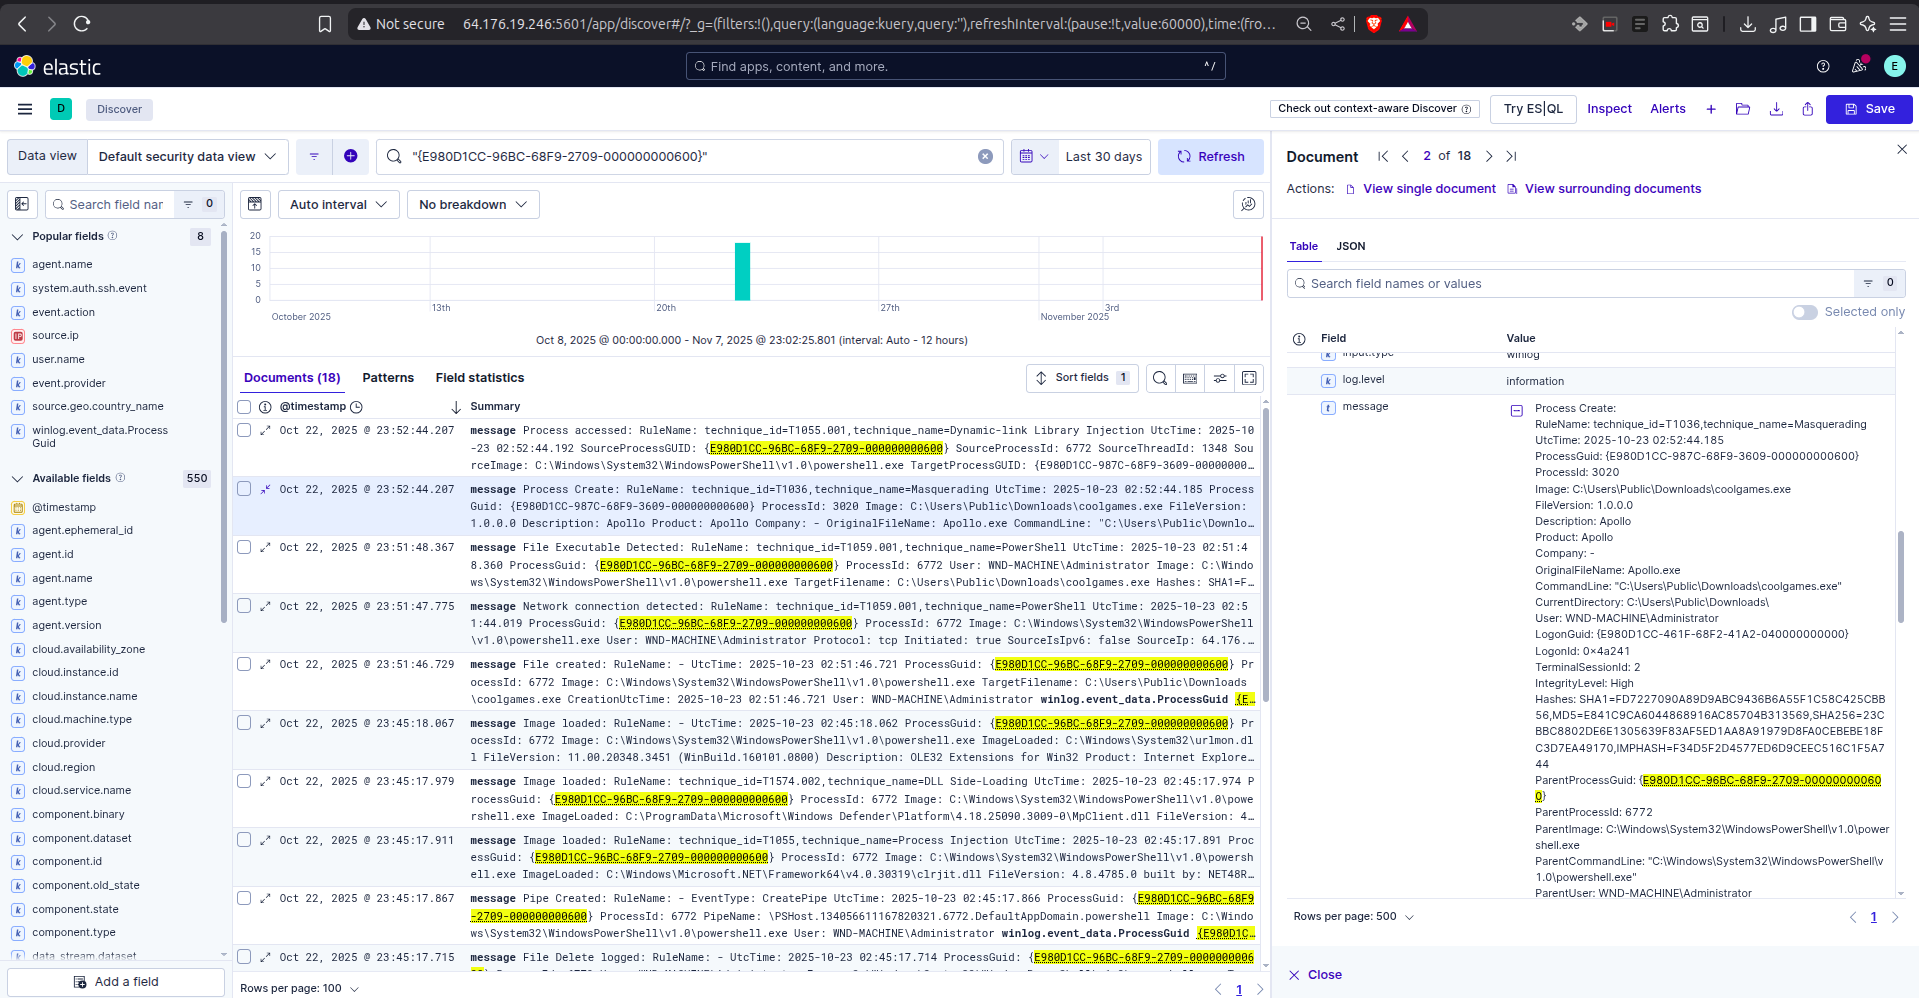
By inspecting the specific “Process Create” event for coolgames.exe, we were able to extract the SHA256 hash: 23CBBC8802DE6E1305639F83AF5ED1AA8A91979D8FA0CEBEBE18FC3D7EA49170. We can now use this hash to blacklist the file globally.
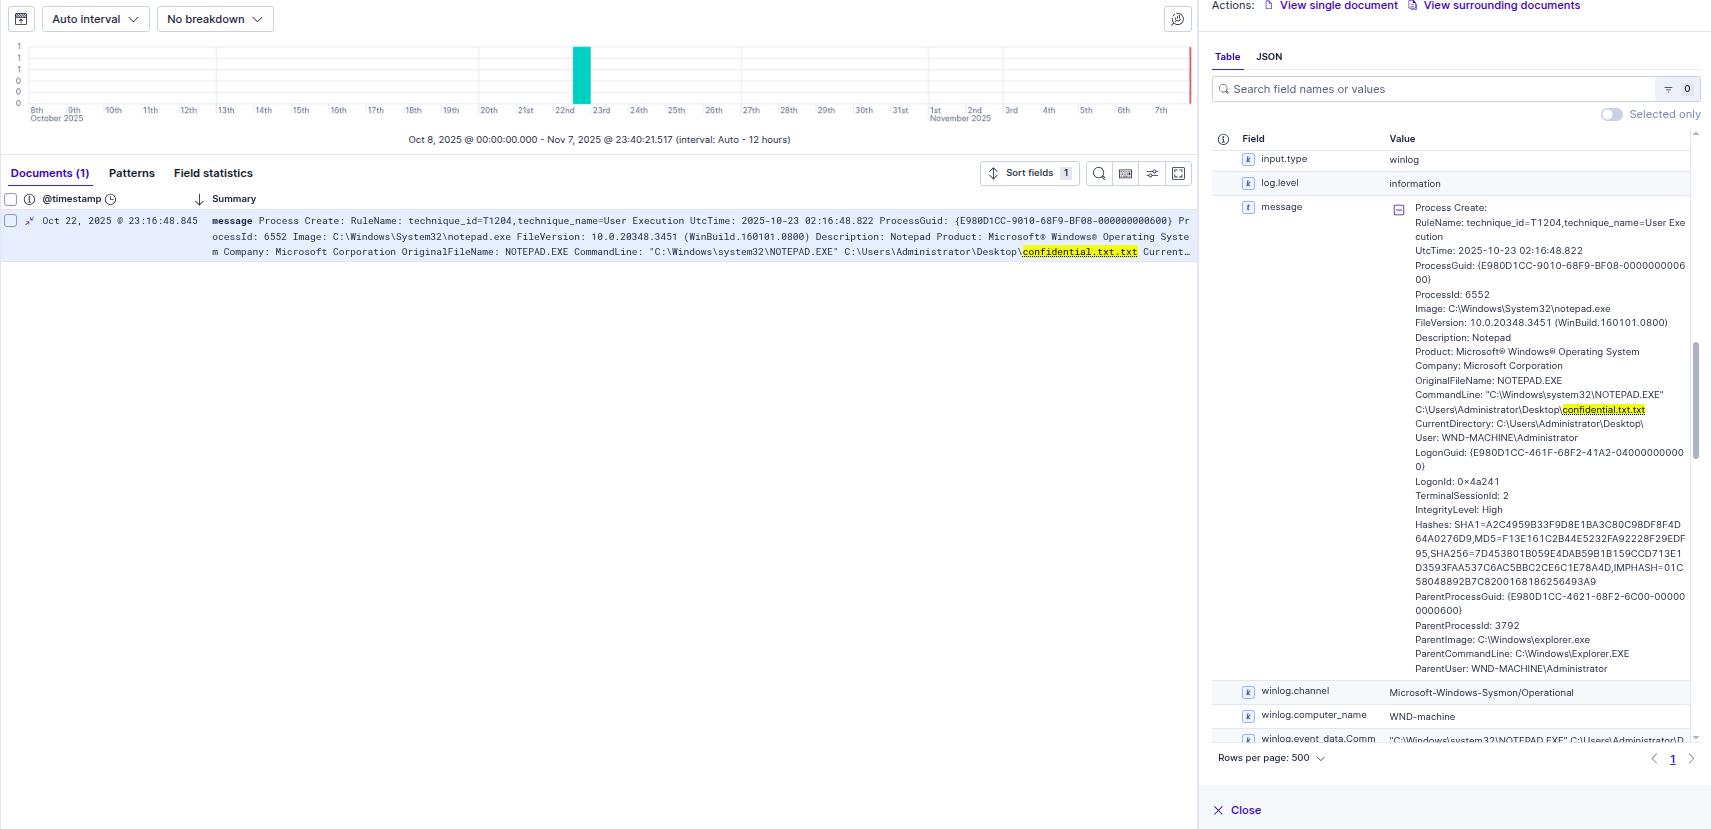
4. Identifying the Exfiltration
Finally, to confirm if the attacker achieved their objective, we searched for access to the sensitive file we planted earlier. The logs captured notepad.exe (spawned by the malware) accessing confidential.txt on the Administrator’s desktop. This timestamp aligns perfectly with the exfiltration we saw in the Mythic console.
Ticketing & Automation
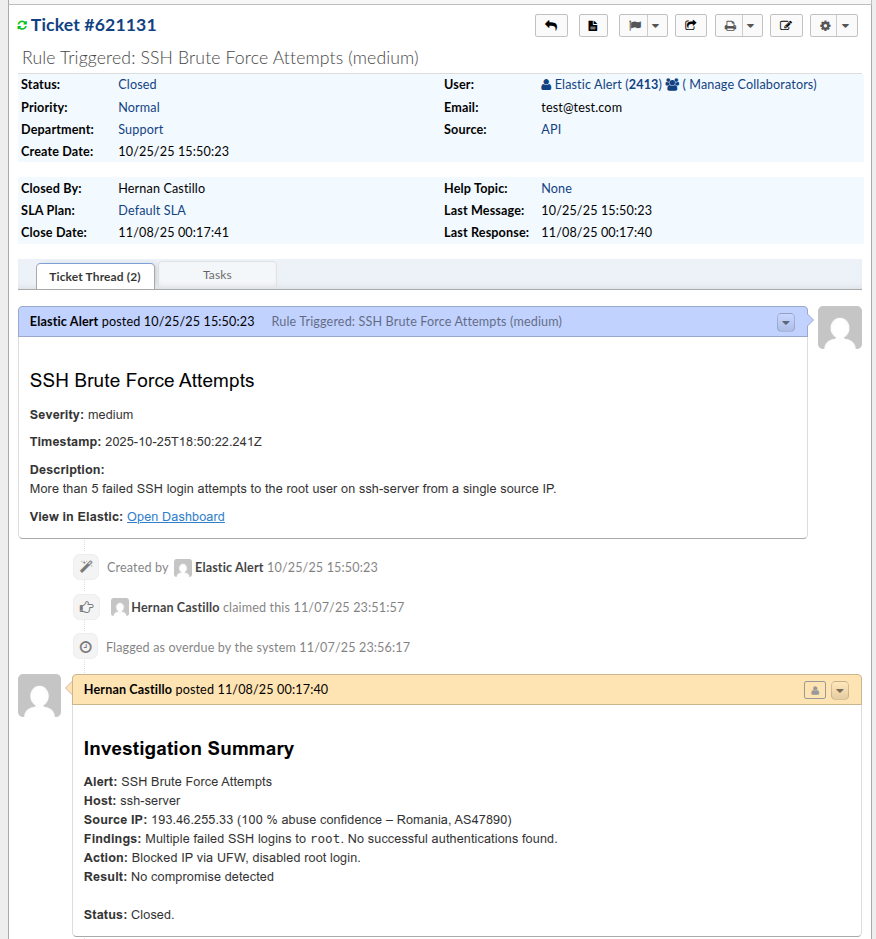
To streamline the triage process, I configured Elastic Connectors to push alerts directly to the osTicket API via webhooks.
- Automation Limitations: Due to constraints with the Elastic connector field mapping, the automated ticket payload is kept lightweight, transmitting only the Severity, Timestamp, Rule Description, and a direct link to the alert.
- How I Answered the Ticket: To compensate for the raw data limits, I used a manual template for every closed ticket to ensure consistency:
- Alert / Host / Source IP: Basic identification.
- Findings: The result of the log investigation.
- Action: Steps taken (e.g., “Blocked IP via UFW”).
- Result & Status: Final outcome (e.g., “No compromise detected,” “Closed”).
Future Improvements
Reflecting on this project, here are a few things I would do differently or improve upon to make the lab even better:
- Alert Tuning: Refine threshold-based rules to reduce the false-positive rate (alert fatigue) encountered during the brute-force phases.
- SOAR Integration: Implement a tool like Shuffle to take active countermeasures, such as automatically blocking attacker IPs at the firewall level.
- Network Segmentation: Introduce host-based firewalls and VLANs to simulate a more hardened enterprise environment and test lateral movement detection.
Credits
This lab was built following the 30-Day MyDFIR SOC Analyst Challenge. A huge thanks to the creators for the excellent guide! You can find the full playlist here: 30-Day MyDFIR SOC Analyst Challenge